Dashboard For Covid-19
Project Description
Stack: CSV · SQL · Power BI
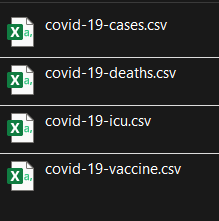
This project focuses on analyzing global Covid-19 data by integrating multiple CSV files (covid-19-cases, covid-19-deaths, covid-19-icu, covid-19-vaccine) into a unified model using SQL. The cleaned and structured dataset was then visualized in Power BI, creating an interactive dashboard to track pandemic trends across countries and over time.
What the dashboard shows
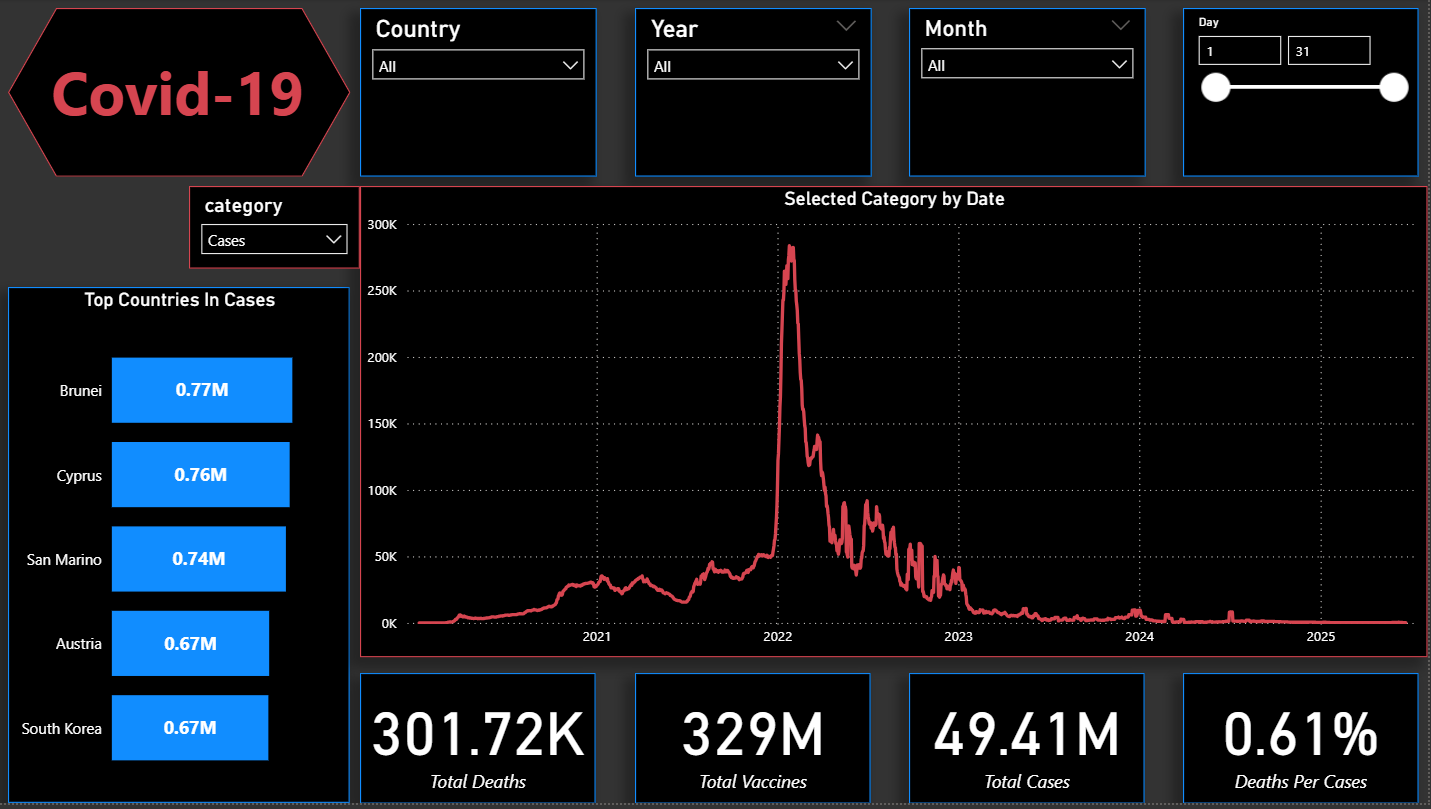
• A timeline chart tracking selected categories (cases, deaths, ICU, vaccines) by date.
• Country-level filters (Country, Year, Month, Day) to drill down into specific periods and locations.
• Top countries by reported cases, ranked with dynamic bar visuals.
• Key global KPIs: total deaths (≈302K), total vaccines (≈329M), total cases (≈49.41M), and death-to-case ratio (≈0.61%).
Outcome & value
The dashboard centralizes Covid-19 reporting from multiple datasets, making it easier for stakeholders to track trends, identify hotspots, and measure the effectiveness of vaccination efforts. With filtering options, decision-makers can analyze country-specific or time-based performance, supporting informed policy and healthcare responses.
Project Screenshots
📌Row Data Screenshot
📌 Dashboard Screenshot
💻 SQL Project Code